
3 in 5 Americans Want Their Community to Be More LGBTQ+ Friendly



LGBTQ+ visibility climbs higher every year. Across the U.S., gay culture is everywhere and impossible to miss. Some people feel at ease being out and proud no matter where they are, while others wrestle with safety worries.
So what is life like for LGBTQ+ Americans in 2024, and do they feel safe where they live?
We polled more than 1,000 LGBTQ+ Americans nationwide about how they see the places they live, and we also dug into data from the U.S. Census Bureau to see where LGBTQ+ households are most common.
Pride Celebrations and Safety
Most LGBTQ+ Americans in our survey (64%) think being out and proud matters in 2024. Over 3 in 5 (61%) would like their cities or towns to be friendlier to LGBTQ+ people, and among rural residents, that wish climbs to more than 4 in 5.
Rural LGBTQ+ respondents are also more likely to have felt unsafe where they live: 38%, compared with the national average of 30%. No wonder they want their towns to be more welcoming.
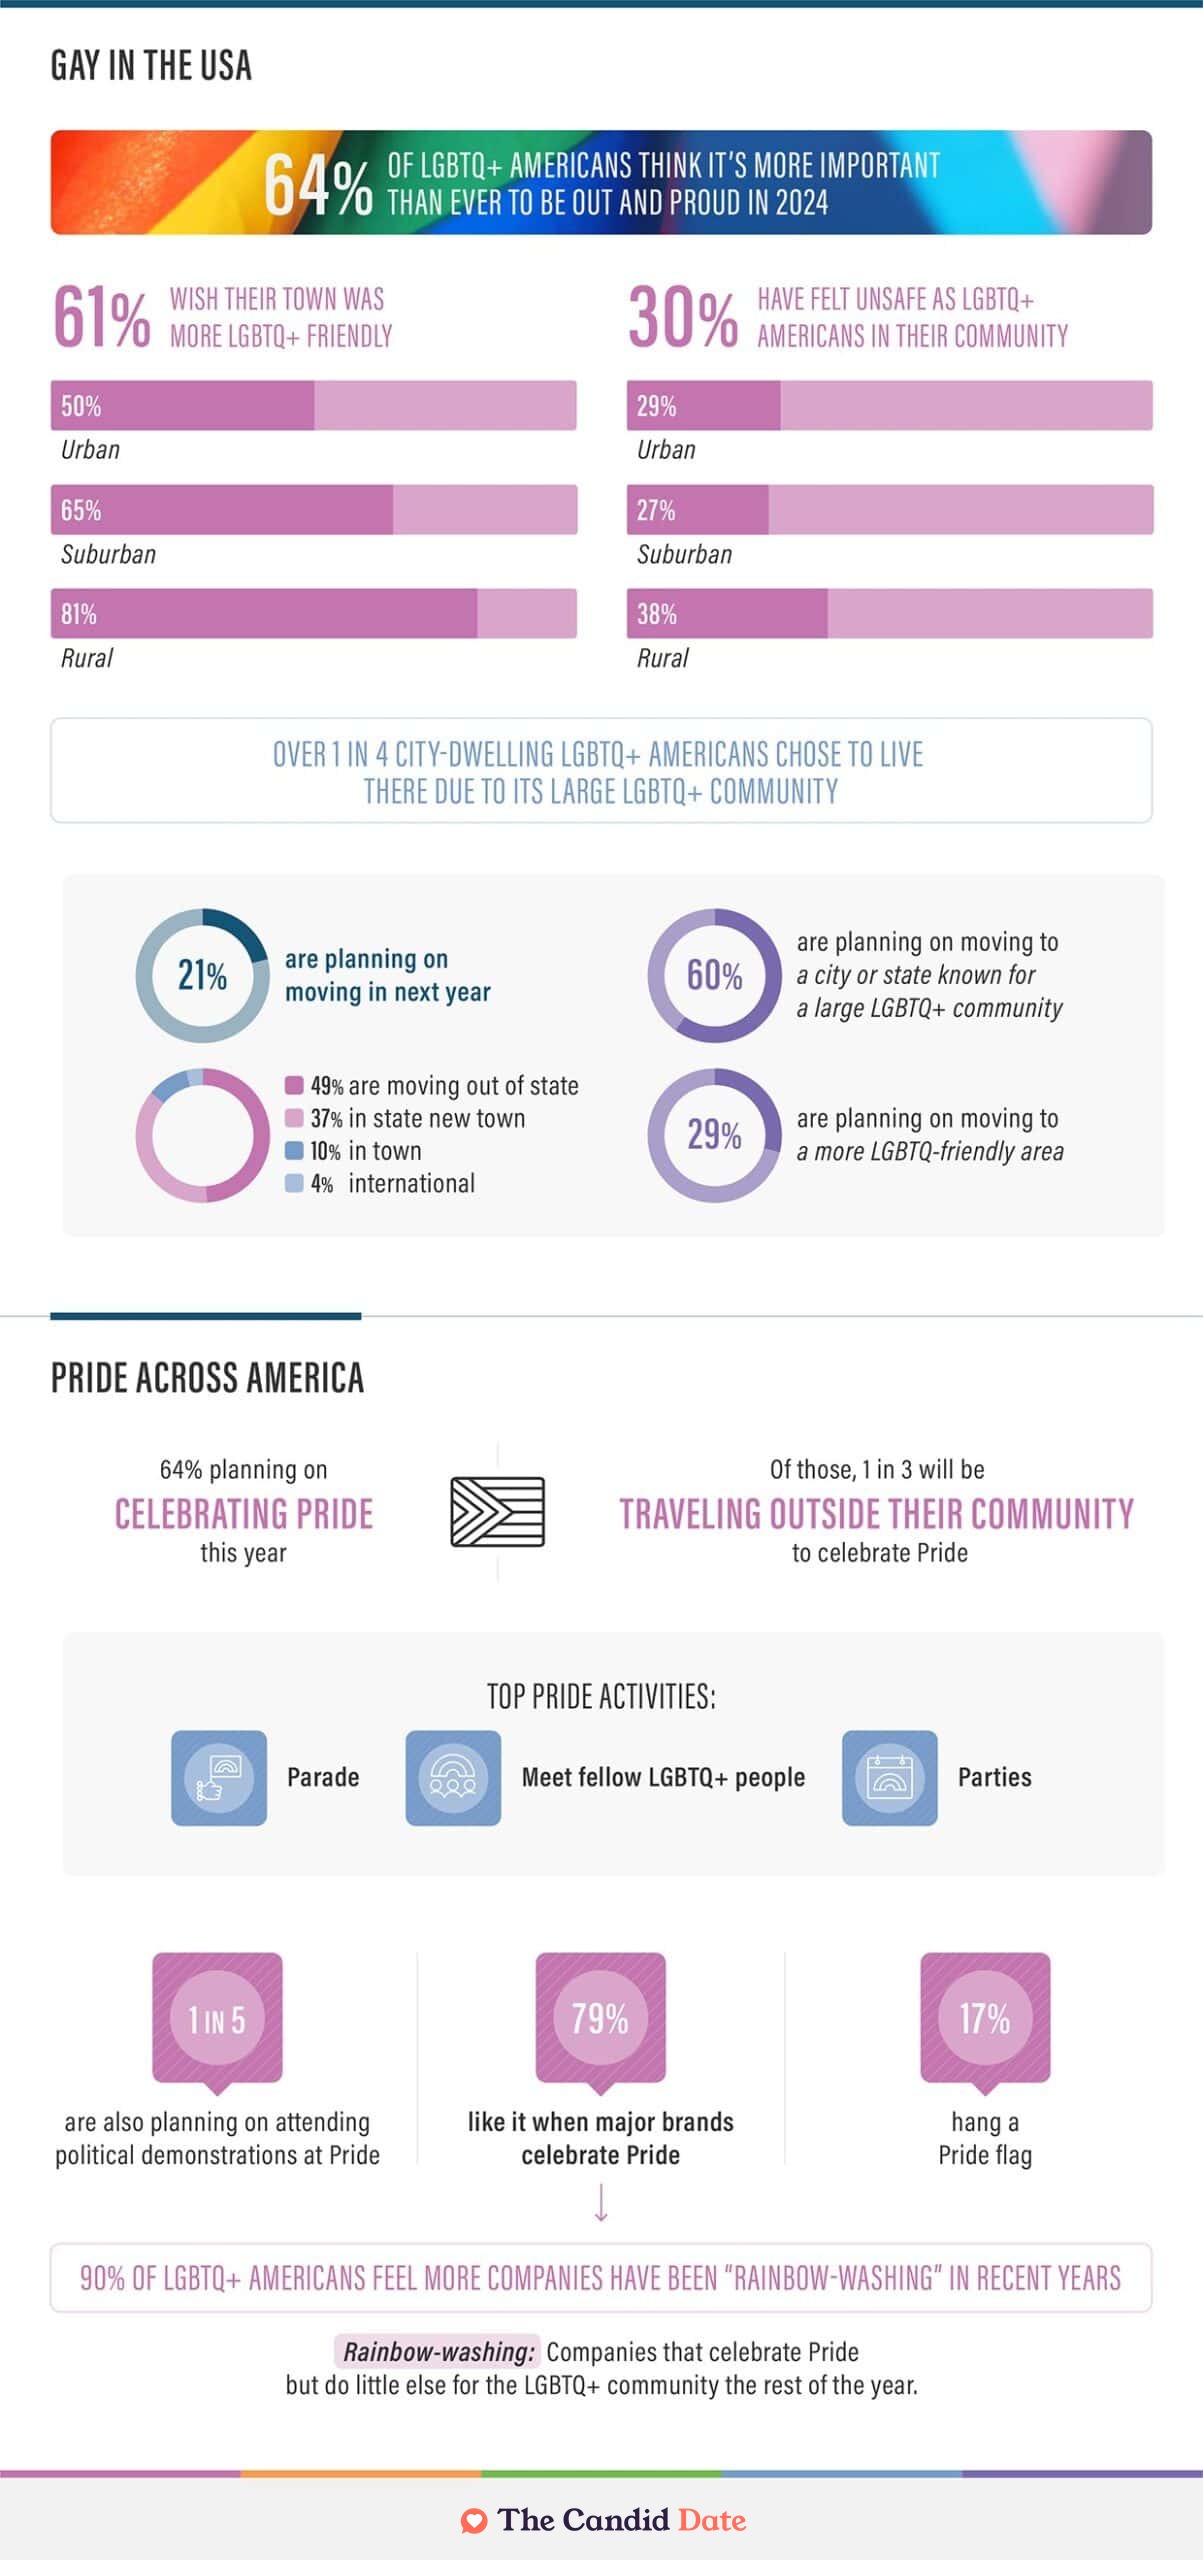
That may also explain why urban LGBTQ+ Americans feel the safest: they already live among bigger LGBTQ+-friendly communities. More than 1 in 4 city dwellers we surveyed picked their city for its large LGBTQ+ community. Roughly 1 in 5 plan to move this year, and most of them (60%) are relocating to a city or state with a reputation for a big LGBTQ+ community. For 49% of respondents, that means leaving their state.
Pride, a series of LGBTQ+ events held in June that usually includes a parade, is central to the LGBTQ+ community, with a long history of fighting for LGBTQ+ rights. Over time it has grown into a monthlong celebration of queer culture, with major brands launching products just for Pride month.
Though 79% of respondents enjoy watching brands celebrate Pride, a full 90% think many companies are “rainbow washing,” paying lip service to Pride while offering the LGBTQ+ community little else for the remainder of the year.
A little over 3 in 5 LGBTQ+ Americans plan to celebrate Pride Month this year, with 1 in 3 traveling beyond their community to do it. Popular plans include attending the Pride parade, going to parties, and meeting other LGBTQ+ people, although 1 in 5 also intend to join political demonstrations.
The Top 5 Cities LGBTQ+ Americans Travel to For Pride Celebrations:
- New York City
- Atlanta
- San Francisco
- Chicago
- Seattle
States Where LGBTQ+ Households Are Most Concentrated
Using U.S. Census Bureau data, we identified the states with the largest LGBTQ+ household populations. Here are the 10 states where LGBTQ+ households make up the largest share of all households:
- Delaware
- Oregon
- Vermont
- Nevada
- Hawaii
- Massachusetts
- California
- Washington
- New Mexico
- Florida
Same Sex Households by State
Percentage of Total Households that are Same-Sex by State
Nationally, LGBTQ+ households are most concentrated in the Northeast and on the West Coast, while the Mountain West and the South have fewer households overall.
Where Gay and Lesbian Households Are Most Common
California leads the nation in total same-sex households, and Wyoming has the fewest. Gay households are most numerous in California, Florida, New York, Texas, and Illinois.
For lesbian households, the leading states are California, Texas, Florida, New York, and Pennsylvania.
States with Most and Least Same-Sex Households
| State | Total Same Sex Households | Total Gay Households | Total Lesbian Households |
|---|---|---|---|
| California | 162,914 | 88,399 | 74,515 |
| Florida | 96,694 | 51,648 | 45,046 |
| Texas | 96,581 | 44,510 | 52,071 |
| New York | 83,518 | 46,308 | 37,210 |
| Illinois | 40,684 | 21,026 | 19,658 |
| Pennsylvania | 40,290 | 18,591 | 21,699 |
| Georgia | 37,440 | 17,508 | 19,932 |
| Ohio | 35,640 | 15,229 | 20,411 |
| Washington | 35,352 | 16,698 | 18,654 |
| North Carolina | 34,857 | 14,617 | 20,240 |
| Massachusetts | 33,452 | 15,145 | 18,307 |
| Arizona | 28,749 | 13,230 | 15,519 |
| New Jersey | 28,043 | 13,553 | 14,490 |
| Virginia | 27,023 | 12,161 | 14,862 |
| Michigan | 26,181 | 10,972 | 15,209 |
| Colorado | 24,562 | 10,843 | 13,719 |
| Maryland | 21,457 | 9,231 | 12,226 |
| Oregon | 21,006 | 8,577 | 12,429 |
| Tennessee | 20,773 | 9,046 | 11,727 |
| Indiana | 20,185 | 8,360 | 11,825 |
| Missouri | 18,780 | 8,116 | 10,664 |
| Minnesota | 17,857 | 8,020 | 9,837 |
| Wisconsin | 16,110 | 6,721 | 9,389 |
| Nevada | 14,504 | 7,436 | 7,068 |
| South Carolina | 14,375 | 5,899 | 8,476 |
| Louisiana | 14,171 | 6,020 | 8,151 |
| Kentucky | 13,419 | 5,605 | 7,814 |
| Connecticut | 12,641 | 5,757 | 6,884 |
| Alabama | 11,737 | 4,762 | 6,975 |
| Oklahoma | 11,621 | 4,775 | 6,846 |
| New Mexico | 9,517 | 3,910 | 5,607 |
| Utah | 8,673 | 4,174 | 4,499 |
| Arkansas | 7,794 | 3,208 | 4,586 |
| Iowa | 7,623 | 3,220 | 4,403 |
| Kansas | 7,412 | 3,042 | 4,370 |
| Maine | 6,582 | 2,628 | 3,954 |
| Hawaii | 6,038 | 3,052 | 2,986 |
| Mississippi | 5,937 | 2,223 | 3,714 |
| New Hampshire | 5,495 | 2,159 | 3,336 |
| Rhode Island | 4,979 | 2,259 | 2,720 |
| West Virginia | 4,877 | 2,037 | 2,840 |
| Delaware | 4,873 | 2,200 | 2,668 |
| Nebraska | 4,495 | 1,890 | 2,605 |
| Idaho | 3,783 | 1,569 | 2,214 |
| Vermont | 3,373 | 1,227 | 2,146 |
| Montana | 2,370 | 901 | 1,469 |
| Alaska | 2,024 | 804 | 1,220 |
| South Dakota | 1,513 | 673 | 840 |
| North Dakota | 1,386 | 607 | 779 |
| Wyoming | 1,154 | 472 | 682 |
The U.S. states with the fewest same-sex households overall are Wyoming, North Dakota, South Dakota, Alaska, and Montana.
Most LGBTQ+ Americans Are Happy Where They Live
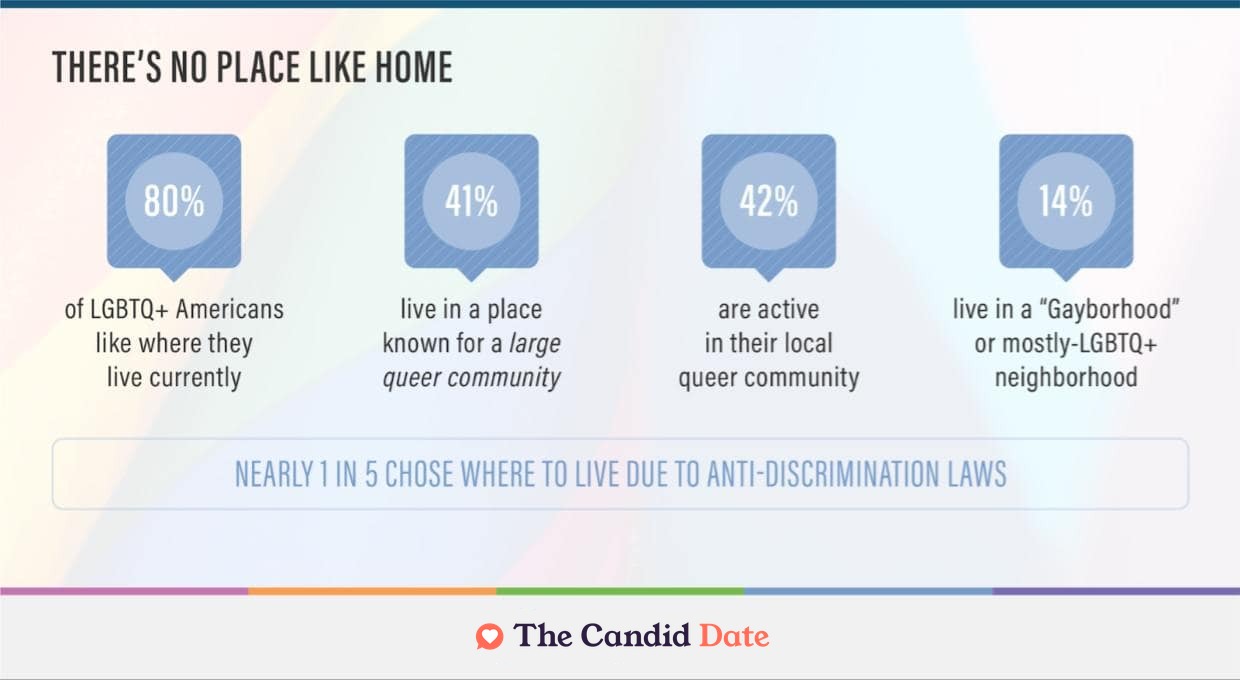
Safety concerns aside, 80% of the LGBTQ+ Americans we surveyed enjoy living where they are now. More than 2 in 5 respondents live somewhere known for a big queer community, and 42% take part in their local queer community.
Among respondents, 14% even live in a “Gayborhood,” meaning a neighborhood made up mostly of LGBTQ+ households. Almost 1 in 5 took a practical approach, picking where they live now because of the area’s anti-discrimination laws.
“This data is both good news and bad news for people of sexual diversity. Seventy percent feel safe in their communities, and 80% of LGBTQ+ respondents say they like living in their neighborhood. However, 3 in 5 want their communities to be more LGBTQ+ friendly. One way to explain this contradiction is this: Feeling like you won’t be subjected to violence or discrimination is one thing. It points to the fact that most Americans are finally tolerant of differences. But there’s a huge difference between feeling tolerated and feeling welcomed. Too many cities and counties in the US do not provide safe spaces, such as Gay bars or other kinds of clubs,” relationship expert Kenji Takahashi told us.
“Despite media claims that we are divided by right- and left-leaning politics, the truth is that we are divided by rural versus urban. The needs of rural people are very distinct from the needs of urban people,” she continued. “Of the 21% who say they are planning to move soon, this probably reflects a common migration from small towns toward more welcoming urban communities.”
Queer Americans don’t have an entirely rosy picture, but there’s plenty of hometown pride to share. LGBTQ+ people live in every state, and many are helping their communities grow and become friendlier to LGBTQ+ people. Here’s to one more Pride month, and another year of progress for every kind of love.
Methodology
In May 2024, we asked 1,000 self-identified LGBTQ+ Americans what they thought about Pride month and where they lived. Respondents were 43% women, 48% men, and 9% nonbinary. Their ages spanned 18-78, averaging 36.
We calculated same-sex household figures using the household characteristics data in the 2020 U.S. Census Dataset.
About the Author
By: Emma Wilson
Editor-in-Chief
Emma Wilson is the Editor-in-Chief at thecandiddate.com. When she was growing up, her family teased her for being 'boy crazy,' but she preferred to think of herself as a budding dating and relationship expert. Emma brings her tireless wit and relatable experiences to thecandiddate.com.
Share the Knowledge!
Our dating experts work hard to show you the best dating sites. Want to show your appreciation? Share this page!